The Complexities of Capacity Pricing
Satellite capacity pricing is dictated by a number of factors, with no two deals being exactly alike. In order to understand the current pricing picture, it helps to understand the context of the current pricing paradigm, and the factors influencing pricing today and into the future. NSR’s recently published Satellite Capacity Pricing Index, Q1 2016 Edition (SCPI) explores and analyzes the underlying factors that influence satellite capacity pricing, while utilizing real-world operator inputs to create a current pricing index. The index finds significant regional variation in pricing, with this coming about due to a number of factors discussed in the study.
Regional Pricing Variations
Regional pricing varies due to a number of factors, with NAM and WEU unsurprisingly being somewhat higher priced than average, and MEA and (to some extent) APAC and LAM being lower priced. Digging deeper into the data, however, interesting trends emerge, highlighting regional tendencies that are beginning to erode as bandwidth in general becomes more commoditized.

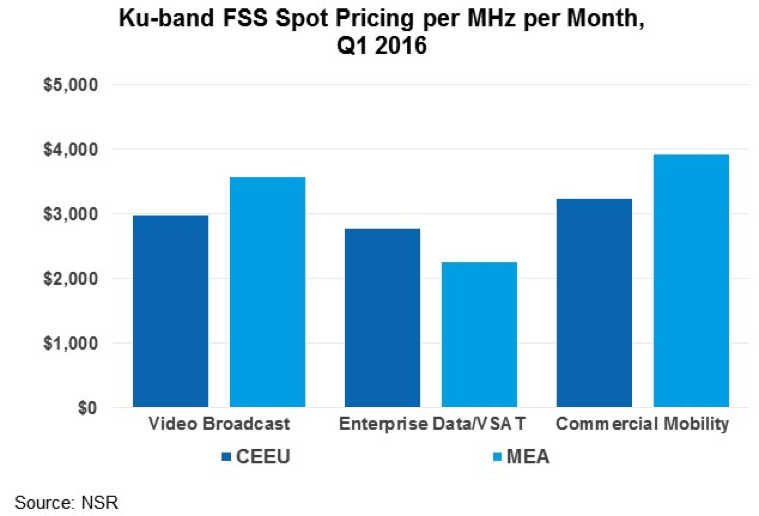
One instance of interesting regional pricing structures includes a comparison of data and broadcast pricing across Central & Eastern Europe (CEEU) and Middle East & Africa (MEA). Indeed, MEA sees somewhat higher than average pricing for Ku-band video broadcast, due to the region’s concentration of video demand at a small number of key orbital slots. NileSat has historically seen very high transponder lease rates, as an example of this concentration of broadcasting demand at one orbital slot. Moving forward, this is expected to be eroded to some extent, with regional players partnering with global ones indicating a response to the very real need for competition for orbital neighborhoods. This contributes to MEA’s video broadcast price point being around 20% higher than Central & Eastern Europe.
Conversely, the more “commoditizable” Enterprise Data demand bucket sees Central & Eastern Europe pricing at more than 20% higher than MEA. This has come about due to a general FSS oversupply in Sub-Saharan Africa, and more recently, the entry of a number of HTS systems in Sub-Saharan Africa including Avanti, YahSat, Eutelsat, and Spacecom. With most industry insiders now accepting as common knowledge the idea that pricing is on the way down, regions like this will be good case studies to see how elasticity of demand functions in a real world setting.
Application Pricing Variations
Different applications have seen very different price movements, with factors such as contract length, switching costs, and the cost of new equipment all playing a role in the “stickiness” of pricing. Regions such as Middle East & Africa, which tend to be made up of a large number of smaller, more cost-conscious customers, are going to see stronger pricing volatility and a closer relationship with “spot pricing”. Mobility pricing has likewise seen stronger volatility, coming from the fact that this is a comparably smaller market that has seen significant new capacity announced and launched over the past few years.
Bottom Line
The satellite telecom industry has by and large accepted that pricing in general is moving downward, as part of a larger trend towards commoditization of connectivity and increasing addressable market size. The evolution of the industry moving forward, driven by lower CAPEX cost per bit and an emphasis on selling orders of magnitude more capacity, will see the above factors influence pricing on a regional and application-specific level. Bottom Line, while pricing is certainly on a downward trajectory, there are many exceptions to this rule. The biggest single factor related to pricing moving forward will be HTS, and with some regions seeing more mature HTS payloads than other regions, their price movements may serve as a strong indicator for the greater market moving forward.


